Mandelbrot set
This popular fractal function generates complex detail however far you zoom in to it [1].
For each point (x, y) the function repeatedly applies a transformation to the complex number represented by x + iy, and counts the number of iterations before the size of the value exceeds 2.
The number of iterations is plotted as a different colour, using the hsv routine in Graphics utilities, or black if the function hasn't diverged after 80 iterations:
(defun mandelbrot (x0 y0 scale)
  (set-rotation 2)
  (fill-screen)
  (dotimes (y 240)
    (let ((b0 (+ (/ (- y 120) 120 scale) y0)))
      (dotimes (x 320)
        (let* ((a0 (+ (/ (- x 160) 120 scale) x0))
               (c 80) (a a0) (b b0) a2)
          (loop
           (setq a2 (+ (- (* a a) (* b b)) a0))
           (setq b (+ (* 2 a b) b0))
           (setq a a2)
           (decf c)
           (when (or (> (+ (* a a) (* b b)) 4) (zerop c)) (return)))
          (draw-pixel x y (if (plusp c) (hsv (* 359 (/ c 80)) 1 1) 0)))))))
The parameters x0 and y0 are the coordinates of the centre of the plot, and scale specifies the scale factor. To plot the whole Mandelbrot set call:
(mandelbrot -0.5 0 1)
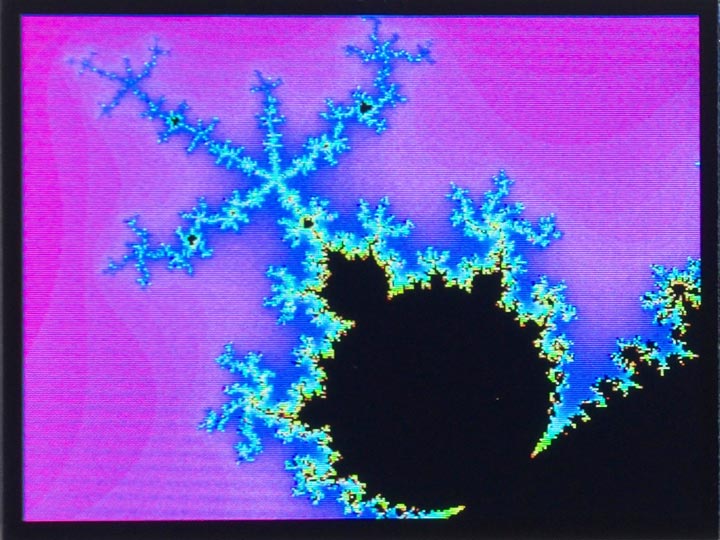
The plot shown above zooms in on a detail, and was obtained with:
(mandelbrot -0.53 -0.61 11)
On a MAiX board at the default clock speed it took 127 s to plot the above detail on a 320 x 240 display.
For a description of how to speed this up by writing the inner loop in RISC-V assembler see Mandelbrot set using assembler.
- ^ Mandelbrot set on Wikipedia.